
 Global connections
 Research & archive









Historical material. Dates, proposals and invitations refer to the time of the original publication.
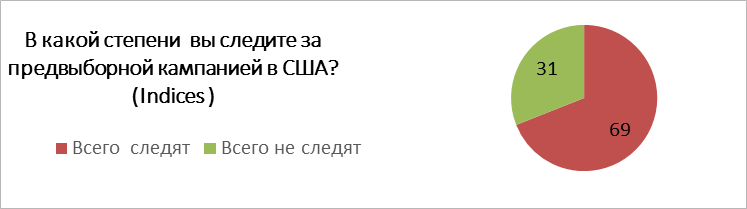
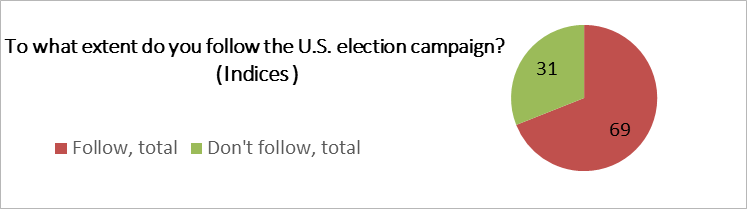
To what extent do you follow the U.S. election campaign? (%)
2/3 of Israelis express a strong interest in the U.S. election campaign, but only 16% follow developments regularly. The religious part of the population follows events significantly less frequently than other groups.
Interest in the election campaign
| Follow | 69% |
|---|---|
| Do not follow | 31% |
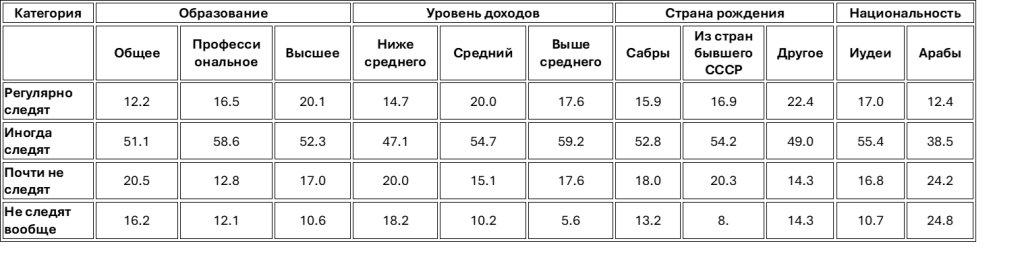
Interest in this topic does not correlate with educational level or country of birth and correlates only slightly with higher income. Jewish respondents are much more likely to follow the topic than Arab respondents: over 70% of the former follow events regularly or occasionally, compared with 50% of the latter.
To what extent do you follow the U.S. election campaign? (%) / Education, income, country of birth and nationality.
| Response | General education | Vocational education | Higher education |
|---|---|---|---|
| Regularly | 12.2 | 16.5 | 20.1 |
| From time to time | 51.1 | 58.6 | 52.3 |
| Rarely | 20.5 | 12.8 | 17 |
| Almost never | 16.2 | 12.1 | 10.6 |
| Response | Below average | Average | Above average |
|---|---|---|---|
| Regularly | 14.7 | 20 | 17.6 |
| From time to time | 47.1 | 54.7 | 59.2 |
| Rarely | 20 | 15.1 | 17.6 |
| Almost never | 18.2 | 10.2 | 5.6 |
| Response | Born in Israel | Born in the former USSR | Other countries |
|---|---|---|---|
| Regularly | 15.9 | 16.9 | 22.4 |
| From time to time | 52.8 | 54.2 | 49 |
| Rarely | 18 | 20.3 | 14.3 |
| Almost never | 13.2 | 8 | 14.3 |
| Response | Jewish population | Arab population |
|---|---|---|
| Regularly | 17 | 12.4 |
| From time to time | 55.4 | 38.5 |
| Rarely | 16.8 | 24.2 |
| Almost never | 10.7 | 24.8 |
To what extent do you follow the U.S. election campaign? (%) / Religiosity
| Response | Secular | Traditional | Religious | Total |
|---|---|---|---|---|
| Regularly | 16.8 | 16.5 | 18.4 | 16.3 |
| From time to time | 55.9 | 58.6 | 48 | 52.7 |
| Total following | 72.7 | 75.1 | 66.4 | 69 |
| Rarely | 17.9 | 12.8 | 22.4 | 18 |
| Almost never | 9.4 | 12.1 | 11.2 | 13 |
| Total not following | 27.3 | 24.9 | 33.6 | 31 |
| Index, index pts | 45.4 | 50.2 | 32.9 | 38 |
Unless otherwise specified, indices are calculated as the difference between the sums of positive and negative responses of varying intensity. This identifies which responses predominate and permits comparisons across groups. The possible index range is -100 to +100 index points.
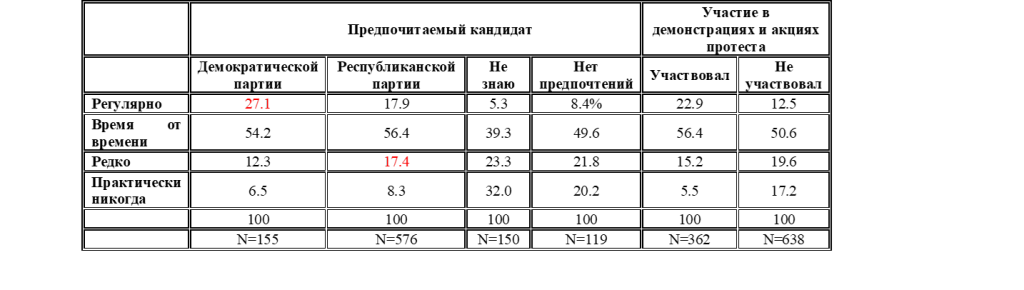
Respondents who prefer a victory for Democratic candidate Kamala Harris follow the U.S. presidential election more frequently (27.1% versus 17.9% among those preferring Donald Trump), as do participants in mass demonstrations.
To what extent do you follow the U.S. election campaign? (%) / Preferred candidate and participation in mass demonstrations
Regular campaign followers, by preferred candidate
| Kamala Harris | 27.1% |
|---|---|
| Donald Trump | 17.9% |
| Response | Prefer the Democrat | Prefer the Republican | Don’t know | No preference |
|---|---|---|---|---|
| Regularly | 27.1 | 17.9 | 5.3 | 8.4 |
| From time to time | 54.2 | 56.4 | 39.3 | 49.6 |
| Rarely | 12.3 | 17.4 | 23.3 | 21.8 |
| Almost never | 6.5 | 8.3 | 32 | 20.2 |
| Total | 100 | 100 | 100 | 100 |
| Respondents, N | 155 | 576 | 150 | 119 |
| Response | Participated in demonstrations | Did not participate |
|---|---|---|
| Regularly | 22.9 | 12.5 |
| From time to time | 56.4 | 50.6 |
| Rarely | 15.2 | 19.6 |
| Almost never | 5.5 | 17.2 |
| Total | 100 | 100 |
| Respondents, N | 362 | 638 |
As expected, respondents who do not engage in socially significant activities are less likely to report regularly following the U.S. election campaign (10.6%, compared with 25–40.2% among members of organizations or volunteers). Political organization members follow these events most actively, followed by civic organization members, with religious community members and volunteers following in comparable proportions.
To what extent do you follow the U.S. election campaign? (%) / Social activity
| Response | Volunteers | Religious community members | Civic organization members | Political party members | None of the above |
|---|---|---|---|---|---|
| Regularly | 26.5 | 25 | 33.8 | 40.2 | 10.6 |
| From time to time | 54.7 | 47.9 | 46.3 | 41.5 | 53 |
| Rarely | 12 | 16.4 | 15 | 11 | 20.4 |
| Almost never | 6.8 | 10.7 | 5 | 7.3 | 16 |
| Total | 100 | 100 | 100 | 100 | 100 |
| Respondents, N | 234 | 140 | 80 | 82 | 658 |
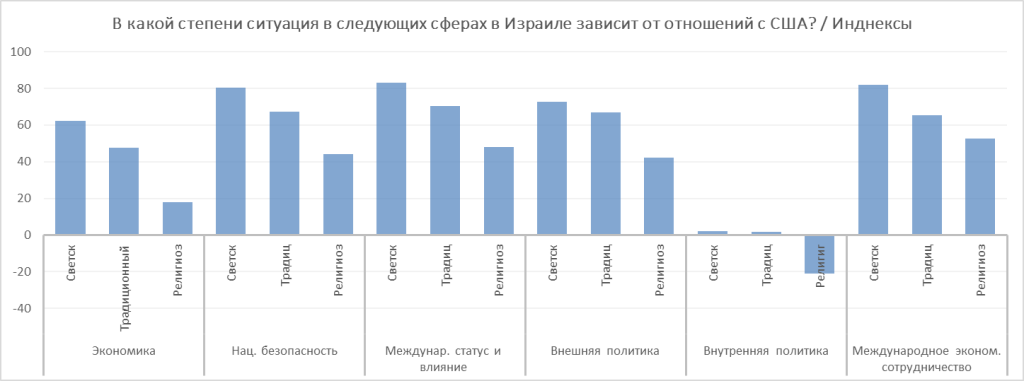
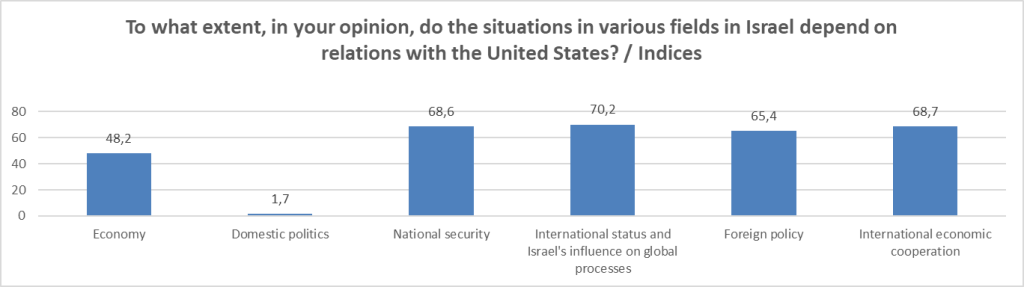
To what extent, in your opinion, does the situation in the following areas in Israel depend on relations with the United States?
Interest in these events reflects the role of the United States in Israeli life.
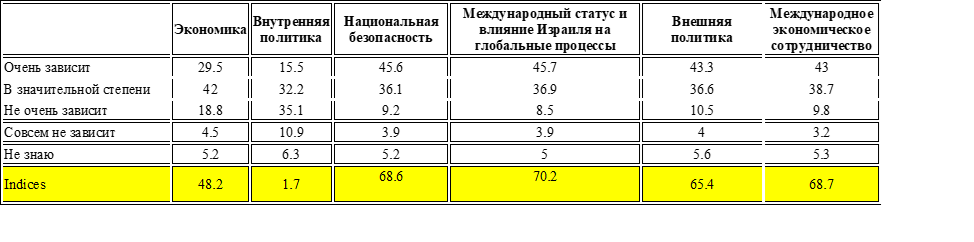
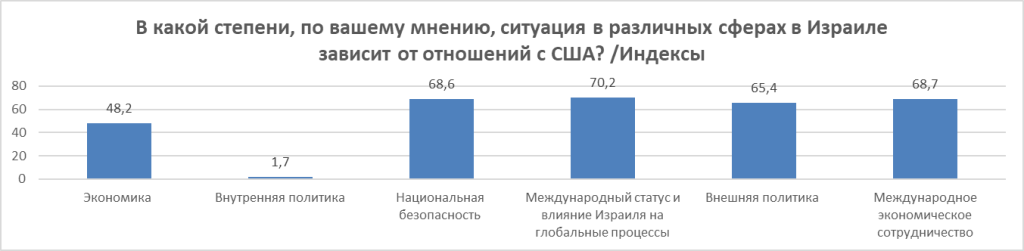
Most Israelis see their country’s international standing and influence on global processes as the areas most dependent on the United States, followed, in descending order, by international economic cooperation and national security.
Relations with the United States
Areas respondents see as dependent on the United States
| Economic stability | +48.2 index pts |
|---|---|
| Domestic politics | +1.7 index pts |
| National security | +68.6 index pts |
| International standing and influence | +70.2 index pts |
| Foreign policy | +65.4 index pts |
| International economic cooperation | +68.7 index pts |
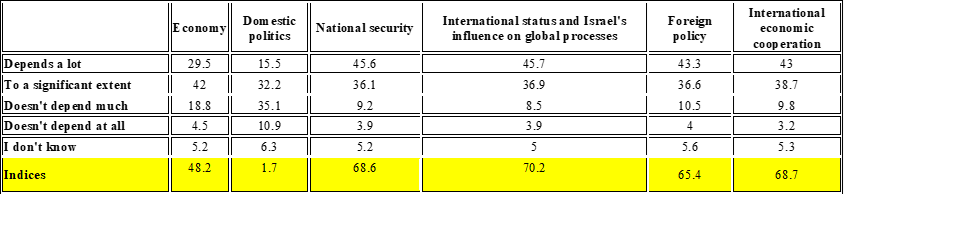
Original chart
| Response | Economic stability | Domestic politics | National security | International standing and influence | Foreign policy | International economic cooperation |
|---|---|---|---|---|---|---|
| Very dependent | 29.5 | 15.5 | 45.6 | 45.7 | 43.3 | 43 |
| Dependent to a significant extent | 42 | 32.2 | 36.1 | 36.9 | 36.6 | 38.7 |
| Not very dependent | 18.8 | 35.1 | 9.2 | 8.5 | 10.5 | 9.8 |
| Not dependent | 4.5 | 10.9 | 3.9 | 3.9 | 4 | 3.2 |
| Don’t know | 5.2 | 6.3 | 5.2 | 5 | 5.6 | 5.3 |
| Index, index pts | 48.2 | 1.7 | 68.6 | 70.2 | 65.4 | 68.7 |
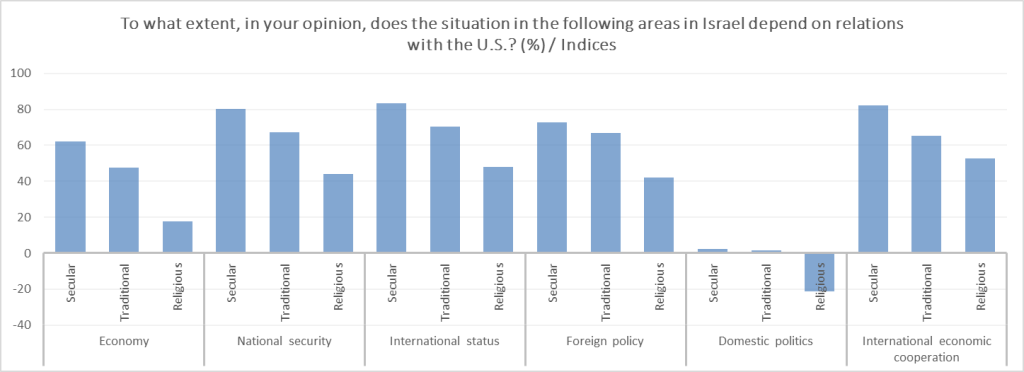
How perceptions of dependence differ
Secular
The highest perceptions of dependence across the areas shown.
Traditional
Intermediate assessments between secular and religious respondents.
Religious
The lowest assessments; the domestic politics index is negative.
Some agreement between secular Israelis and those with varying degrees of religiosity — traditional and Haredi — on the dependence or independence of different aspects of Israeli life is found only in domestic politics.
This is the only area that Israelis tend to regard as relatively independent of the United States, as indicated by dependency indices close to zero or below zero.
In all other areas there is a general pattern: secular Israelis perceive greater dependence on the United States, traditional respondents somewhat less, and religious respondents report the lowest levels of dependence.
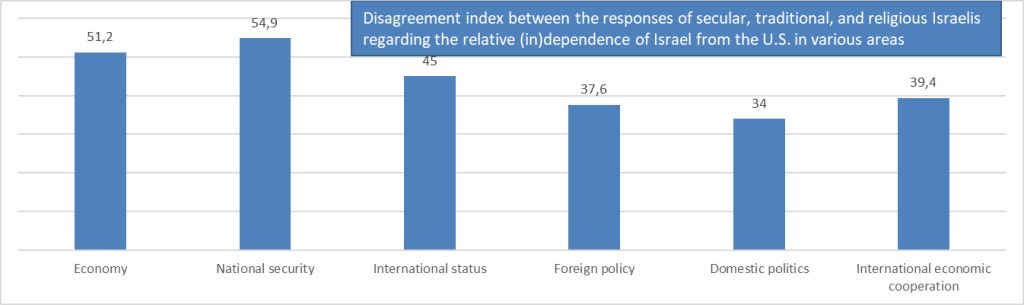
Differences between groups: the author’s index
| Category | Index, index pts |
|---|---|
| Economic stability | 51.2 |
| National security | 54.9 |
| International standing and influence | 45 |
| Foreign policy | 37.6 |
| Domestic politics | 34 |
| International economic cooperation | 39.4 |
Domestic politics: Jewish and Arab respondents
The English research section reports differences between Jewish and Arab respondents primarily in domestic politics: Arab respondents more often view this area as dependent on the United States and less often as independent.
| Response | Jewish population | Arab population |
|---|---|---|
| Very dependent | 13.9 | 23.6 |
| Dependent to a significant extent | 32.1 | 32.9 |
| Not very dependent | 36.5 | 28 |
| Not dependent | 11.9 | 5.6 |
| Don’t know | 5.6 | 9.9 |
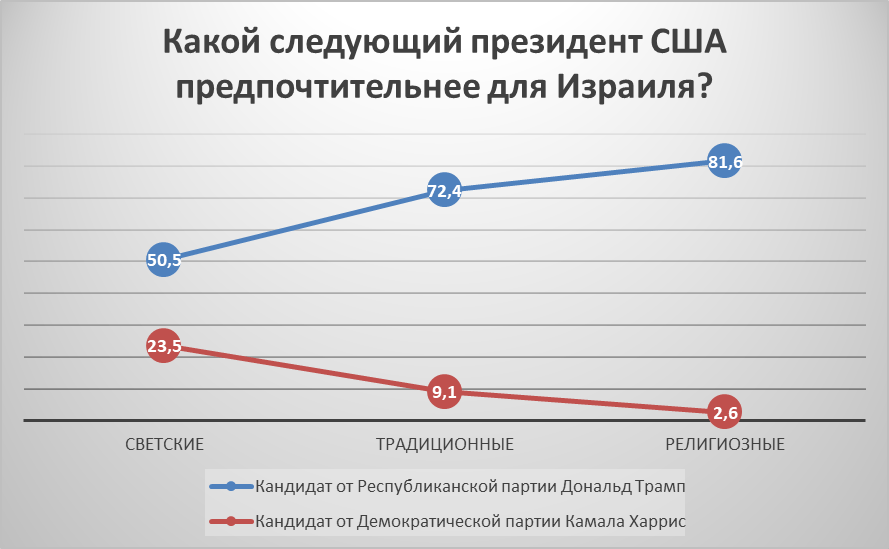
Nearly 60% of respondents believe a victory for Republican candidate Donald Trump would be preferable for Israel, whereas the Democratic candidate Kamala Harris is preferred by only 15% of respondents.
Preference profiles differ by religiosity. Harris’s share should be compared across groups without mistaking that difference for a lead within each group.
- secular Israelis are much more likely to express a preference for Democratic candidate Kamala Harris, whereas
- religious Israelis favor Republican candidate Donald Trump.
Preference for Trump increases from secular to traditional and then to religious Israelis. Conversely, the share preferring Kamala Harris is highest among secular respondents, slightly lower among traditional respondents and lowest among religious respondents.
Which candidate is considered preferable for Israel
| Secular · Donald Trump | 50.5% |
|---|---|
| Secular · Kamala Harris | 23.5% |
| Traditional · Donald Trump | 72.4% |
| Traditional · Kamala Harris | 9.1% |
| Religious · Donald Trump | 81.6% |
| Religious · Kamala Harris | 2.6% |
Which prospective U.S. president, in your opinion, would be preferable for Israel? (%)
| Response | Secular | Traditional | Religious | Total |
|---|---|---|---|---|
| Donald Trump | 50.5 | 72.4 | 81.6 | 57.6 |
| Kamala Harris | 23.5 | 9.1 | 2.6 | 15.5 |
| No preference | 7.9 | 8.4 | 5.9 | 11.9 |
| Don’t know | 18.1 | 10.1 | 9.9 | 15 |
| Total | 100 | 100 | 100 | 100 |
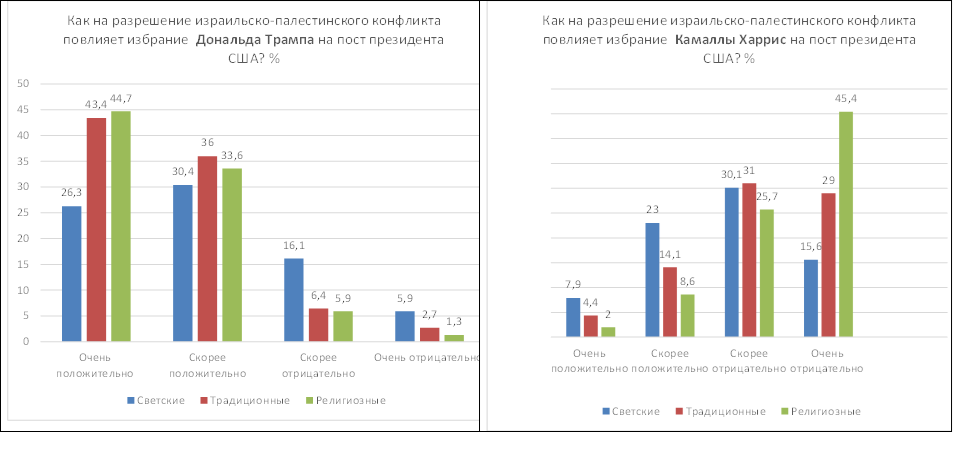
How do you think the election of each of the following U.S. presidential candidates would affect resolution of the Israeli–Palestinian conflict? (%)
Expectations of conflict resolution
Expected effect on resolving the conflict
| Donald Trump | +46.8 index pts |
|---|---|
| Kamala Harris | -24.5 index pts |
Original chart

| Category | Very positive | Rather positive | Rather negative | Very negative | Don’t know | Index, index pts |
|---|---|---|---|---|---|---|
| Donald Trump | 33.8 | 30.3 | 12 | 5.3 | 18.6 | 46.8 |
| Kamala Harris | 7.3 | 18.6 | 27.7 | 22.7 | 23.7 | -24.5 |
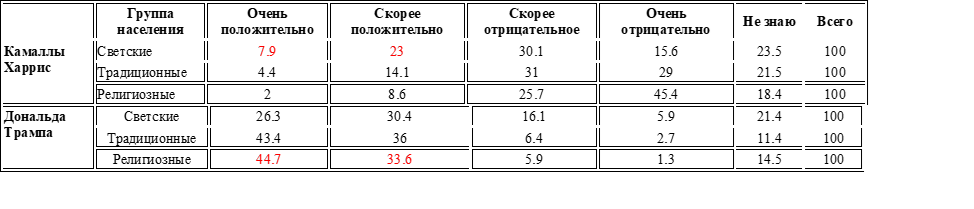
As the charts show, in the context of resolving the Israeli–Palestinian conflict , traditional and religious respondents are considerably more likely to choose “positive” and “very positive” when assessing Trump’s role if he wins (approximately 44% in each of these groups choose “very positive”, compared with 26% of secular Israelis).
Secular Israelis, in contrast, more frequently choose “rather negative” (16.1 versus an average of 6% in the other groups) and “very negative” (6% versus 2–4%, respectively). Compared with traditional and religious respondents, secular respondents are more likely to expect a very or rather positive role for Kamala Harris in resolving the conflict if she is elected president.
How would the election of each of the following U.S. presidential candidates affect resolution of the Israeli–Palestinian conflict? % / By religiosity
| Response | Secular | Traditional | Religious |
|---|---|---|---|
| Very positive | 26.3 | 43.4 | 44.7 |
| Rather positive | 30.4 | 36 | 33.6 |
| Rather negative | 16.1 | 6.4 | 5.9 |
| Very negative | 5.9 | 2.7 | 1.3 |
| Don’t know | 21.4 | 11.4 | 14.5 |
| Total | 100 | 100 | 100 |
| Response | Secular | Traditional | Religious |
|---|---|---|---|
| Very positive | 7.9 | 4.4 | 2 |
| Rather positive | 23 | 14.1 | 8.6 |
| Rather negative | 30.1 | 31 | 25.7 |
| Very negative | 15.6 | 29 | 45.4 |
| Don’t know | 23.5 | 21.5 | 18.4 |
| Total | 100 | 100 | 100 |
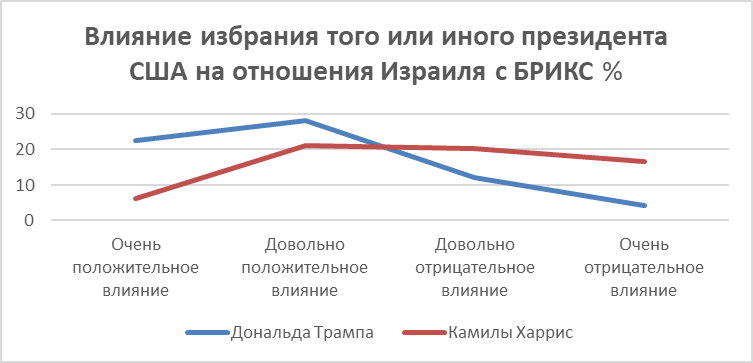
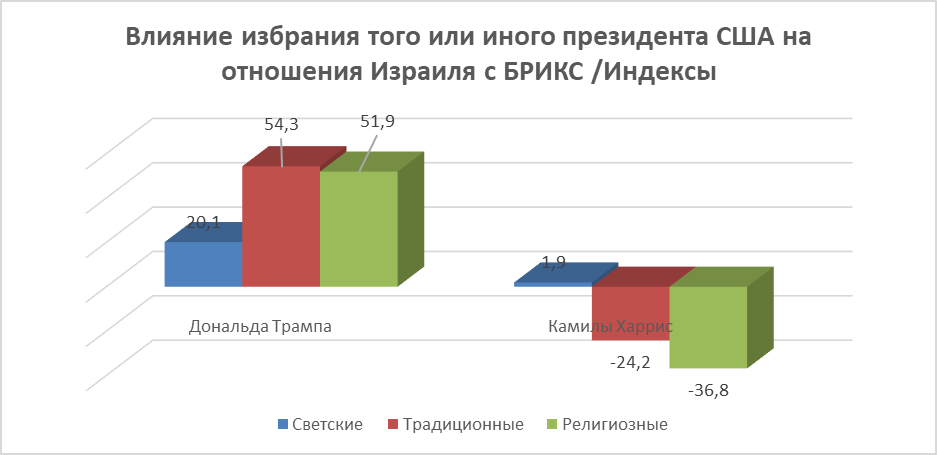
Israelis generally associate the development of Israel’s relations with BRICS with a Donald Trump victory in the presidential election.
However, secular respondents are also more likely than traditional and religious respondents to expect Kamala Harris to have a positive effect on Israel’s relations with BRICS, and less likely to expect the same from Donald Trump.
How respondents compared candidates’ effects on BRICS
Positive effects
The original graph shows higher “very” and “rather positive” response shares for Trump.
Negative effects
“Rather” and “very negative” shares are higher for Harris.
Expected effects on relations with BRICS
| Secular · Donald Trump | +20.1 index pts |
|---|---|
| Secular · Kamala Harris | +1.9 index pts |
| Traditional · Donald Trump | +54.3 index pts |
| Traditional · Kamala Harris | -24.2 index pts |
| Religious · Donald Trump | +51.9 index pts |
| Religious · Kamala Harris | -36.8 index pts |
Original chart
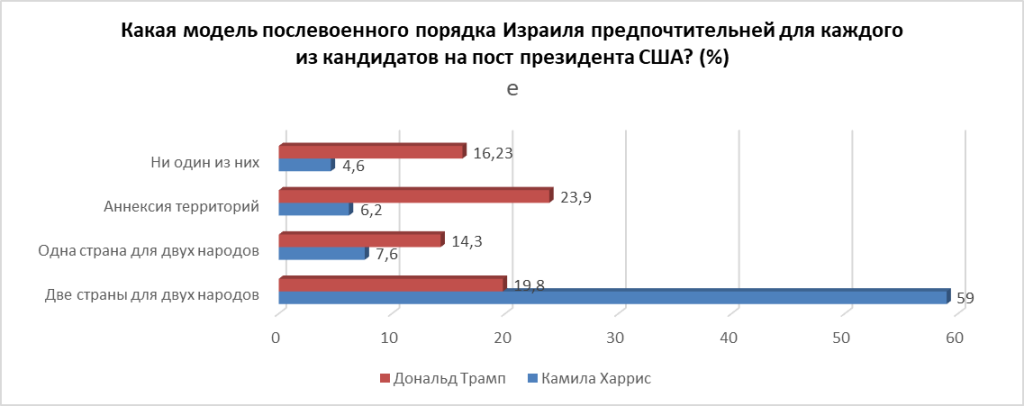
Asked which model of a postwar order each U.S. presidential candidate would prefer, respondents show an unusually strong consensus concerning Kamala Harris and her perceived preference for “two states for two peoples”: 59% of respondents selected this answer.
For comparison, among the other answers concerning both candidates, the largest figure is 25.7% for “don’t know” regarding Donald Trump’s position.
Respondents most often expect Donald Trump to favor “annexation of territories” (23.9%).
Expected models of a postwar order
| None of these models · Donald Trump | 16.23% |
|---|---|
| None of these models · Kamala Harris | 4.6% |
| Annexation of territories · Donald Trump | 23.9% |
| Annexation of territories · Kamala Harris | 6.2% |
| One state for two peoples · Donald Trump | 14.3% |
| One state for two peoples · Kamala Harris | 7.6% |
| Two states for two peoples · Donald Trump | 19.8% |
| Two states for two peoples · Kamala Harris | 59% |
| Category | Donald Trump | Kamala Harris |
|---|---|---|
| None of these models | 16.23 | 4.6 |
| Annexation of territories | 23.9 | 6.2 |
| One state for two peoples | 14.3 | 7.6 |
| Two states for two peoples | 19.8 | 59 |
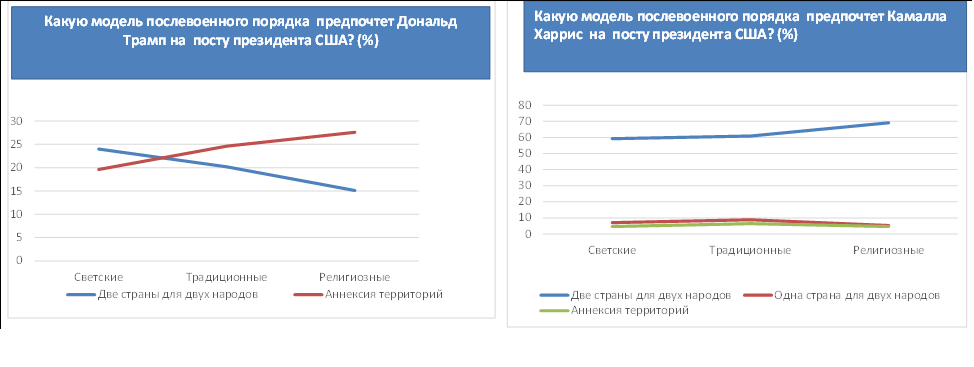
In general, expectations regarding Kamala Harris’s preferred model of Israel’s postwar order are almost identical across groups defined by religiosity, unlike expectations concerning Donald Trump’s preferred model.
Two opposing trends are apparent here. . As religiosity decreases from religious to secular respondents, the share attributing to him a preference for “two states for two peoples” rises from 15.1% to 24%, while the share choosing “annexation of territories” falls from 27.6% to 19.6%.
Trump’s model: comparing the endpoint groups
| Two states for two peoples · Religious | 15.1% |
|---|---|
| Two states for two peoples · Secular | 24% |
| Annexation of territories · Religious | 27.6% |
| Annexation of territories · Secular | 19.6% |
Models and religiosity: what the source figure shows
Expectations of Trump
From secular to religious respondents, expectations of two states decline and expectations of annexation increase.
Expectations of Harris
The two-state line is above the other models in all three groups; exact points are unlabelled.